Fact-Checking in Science Reporting
It can be tricky to write about science, technology, health, and the environment. Many writers—particularly those who are inexperienced or who don’t have a good grasp on how science functions—may unintentionally twist or obscure facts. When you’re fact-checking, make sure you understand technical sources, from scientists to scientific papers to datasets. Here are ten common ways to make a mistake, in no particular order:
1. Correlation ≠ Causation
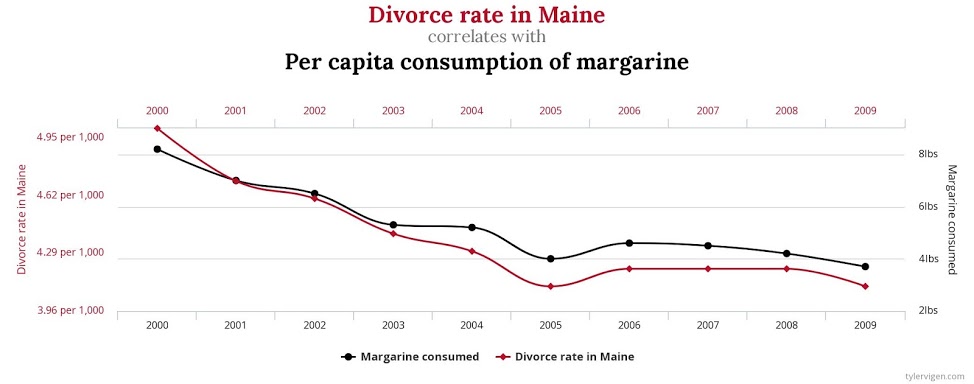
Sometimes a dataset of Thing A seems to follow the same trend as a dataset of Thing B. Still, this doesn’t mean Thing A is causing Thing B or vice versa. In fact, you can graph all sorts of datasets in ways that make it look like they are connected, even though they are not. The graph below shows a great example from Tyler Vigen’s Spurious Correlations (for more, check out the website and book).
Worth noting: Even legitimate studies that try to tease out more reasonable relationships can’t always determine causation. For example, observational or epidemiological studies may hint at a real phenomenon, but they can’t prove it. For more on these types of studies, see this great explainer at HealthNewsReview.

2. Numbers and Units
Basic typos may turn millions into billions and conversion errors may miscalculate, for instance, how many miles are in a kilometer. There’s a difference between a European Billion (1,000,000,000,000) and an American Billion (1,000,000,000) because they are on the long numeric scale and short numeric scale, respectively. Still, not every country in Europe uses a European Billion. A ton (2,000 lbs) isn’t the same as a tonne (1,000 kg or 2,204.6 lbs). And a change in percentage points isn’t the same as a change in percentage: A change from 50 percent to 60 percent is a increase in 10 percentage points or of 20 percent.
In short: Always double check every number. Not sure how to double-check some of those pesky numbers? This tip sheet on math and stats from Journalist’s Resource should help.
3. Absolute Risk ≠ Relative Risk
Consider the made-up headline: “Coffee Boosts Cancer Risk by 25 Percent”
Sounds scary, eh? A good fact-checker would dig into the research behind this headline to see just how scary it actually is.
Risk communicates how likely it is that a certain harmful event will happen. For instance, an epidemiological study, also called an observational study, may show the likelihood that a particular material causes cancer, while a medical study on a new drug may show how often the drug reduces the risk of a disease.
But studies often report these likelihoods in terms of relative risk, which compares two test groups. A reporter may confuse the relative risk as absolute, or the likelihood of that event happening in any scenario.
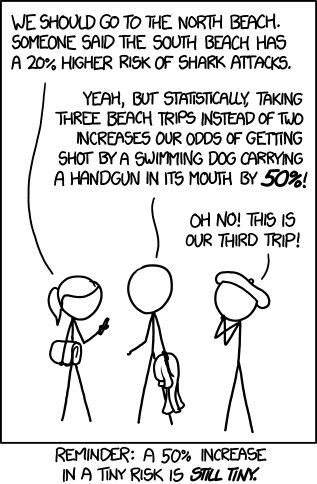
So, in the case of the cancer-causing coffee: Say a hypothetical study compared a group of coffee drinkers to coffee abstainers and found that the abstainers got cancer 0.001 of the time while the drinkers got it 0.00125 percent of the time. In relative terms, that’s a 25 percent risk increase. But overall, it’s still a tiny risk. As written, the above headline makes it sound like anyone who drinks coffee increases their chances of cancer by 25 percent.
For more on absolute and relative risk, as well as for a list of helpful questions to ask when it comes to hazards and risks, see Risk Reporting 101 at the Columbia Journalism Review.
(Note: A single study that claims to tie coffee to cancer would require scrutiny for other reasons. See Correlation ≠ Causation above and Single Study Syndrome below.)

4. Single Study Syndrome
Science isn’t settled in a single paper or lab experiment. Rather, showing how the natural world works takes a cumulative and collaborative body of work. So if an article cites the findings of single study as the final say on a topic, it’s probably wrong. And unfortunately, because the news tends to favor stories that are new, a lot of science reporting goes after the latest research findings.
If your outlet must publish an article on a single study, be sure to add the proper context on the findings from the broader literature and independent experts. Look for other research on the same topic in databases such as Google Scholar, PubMed, and JSTOR. It’s also a good idea to interview a few experts in the same field who are independent of the new study, both to get their take on the paper and to be sure you understand the relevant body of scientific literature.
For more on how academic publishing works, including some extra info on single-study-syndrome, check out this post at Journalist’s Resource.
5. Statistical Significance and P-values
Scientists often rely on statistics to understand their data. Two common, and related, stats tools: statistical significance and the p-value. But don’t take too much credence in either of these numbers on their own.
Statistical significance is supposed to show how likely a result is due to chance. So, the greater the significance, the more likely a result is showing a real phenomenon; the lower, the more likely you’re just seeing noise. But please: significance does not translate directly to importance.
The p-value indicates the probability that your case is statistically significant. It is usually written as p<0.05 (where 0.05 could be any number, although it’s usually a small number). In this example, the p-value translates to a five percent or less chance that a result isn’t statistically significant. Different fields require different p-value ranges, though. For instance, if p<0.05 means you have a five percent error rate, that is fine for an economist who is building an economic model, but horrific for an engineer who is building a bridge.
Big caveat: p-values are hard to define and are often abused and misused (also called p-hacking). In 2019, many prominent statisticians formally disavowed the p-value as a useful stand-alone tool.
So, if you see a story that cites a p-value or discusses the statistical significance of a result, dig into that number to see if it actually says what the writer—and the scientists, for that matter—think it does.
When in doubt, call an independent statistician and ask: How might this result be misunderstood? How important is the p-value in this study?
Want to read more on p-values? Check out this handy Q&A with science journalist Christie Aschwanden at Journalist’s Resource.
6. Size Matters
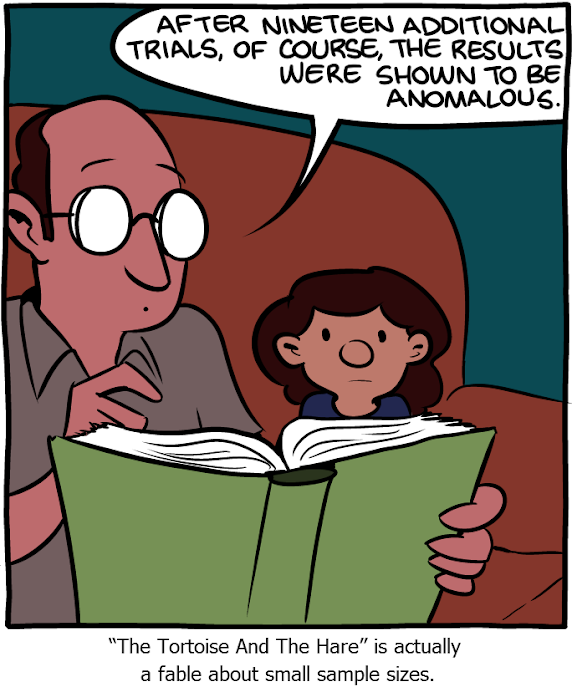
When scientists do a study, they typically have to work with a subset of people (or animals or whatever) and extrapolate their findings to the larger population. How they select that subset, or sample, matters. If a sample size is too small, for example, it won’t reflect the larger population. If a story cites a study with a small sample size, the story should give context: What the sample size actually was and why it may not mean much more broadly.
Another key measurement is the effect size, which more or less shows how strong a result is when comparing two groups. In a study on a drug, for example, researchers may claim that there is a statistically significant improvement in a group that received the drug compared to one that did not (the control). But the effect size may be so small that the drug wouldn’t actually do much for most patients in a real-world scenario. For more on effect size, see this explainer from Journalist’s Resource.

7. False Balance
Journalism ethics dictate that reporters should be balanced in their work. In a sense: Get comments from both sides (or many sides, as appropriate). But in some cases, seeking the other side of a story actually introduces a false sense of balance—particularly in many science stories, where the majority of the evidence falls to one side.
Examples:
- An article on climate change that includes unchallenged views from a climate denier
- A news clip that includes interviews from flat-earth conspiracy theorists
- A piece about measles and vaccine safety that includes unsubstantiated claims from a anti-vaccine activist
For more, read this explainer from the Online News Association.
8. Mice Aren’t Humans
A lot of research, particularly in biomedicine, happens in animals. Some of this research moves to additional studies, human trials, and even your medicine cabinet. But most of it doesn’t—even research that seems to cure a mouse of a disease, or otherwise improve its health.
Why? Because mice aren’t humans. What works in a mouse doesn’t always translate to what works in us. If you’re fact-checking an article that claims that scientists just cured cancer, take a look at the original study and make sure they didn’t cure cancer in mice.
The popular Twitter account @justsaysinmice is dedicated to highlighting this mistake in published articles (see below). Don’t let your articles end up on @justsaysinmice’s Twitter feed.
Want more insight on animal studies? Check out this great advice from HealthNewsReview.
9. Consider the Source
Just because someone is a scientist doesn’t mean they’re always right. It also doesn’t guarantee they are trustworthy. Same goes for a scientific journal: Some are legitimate, some are not. Be sure to look at a source’s potential conflicts of interest, such as funding or affiliations. Scientific journals should be peer-reviewed (an imperfect but key process nonetheless). And beware of potentially predatory journals, which charge researchers to publish and have a reputation for shoddy papers.
10. Don’t Believe the Hype
No one can peer into the future. That even goes for doctors, scientists, and technologists. Beware of flashy claims about potential treatments and products. Look for unbiased experts who can help give a claim context. Also, avoid words including: Breakthrough, holy grail, cutting-edge, and anything else that reads more like PR than journalism.


